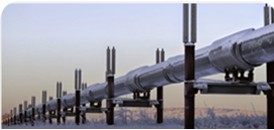
Oil and Gas Pipe Line Monitoring System
Oil and Gas Pipe Line Monitoring System Industrial Solution Deep Dive: As a part of this section, we will be looking at tracking Oil and Gas pipe line monitoring system leveraging AI and IoT giving both Industrial Solution Deep Dive as well as detailing about the Application stack leverages. The section would include the following: […]